

Last updated:
The Mathematics Behind Trading Plans
Most investors think about returns. The system in The Savvy Investor's Playbook thinks about asymmetry. Here are the six mathematical instruments; ROI, CAGR, Sharpe Ratio, ATR, position sizing, and the break-even recovery table; every serious investor needs to understand.

The Mathematics Behind Trading Plans
Most investors think about returns.
The system in this book thinks about asymmetry.
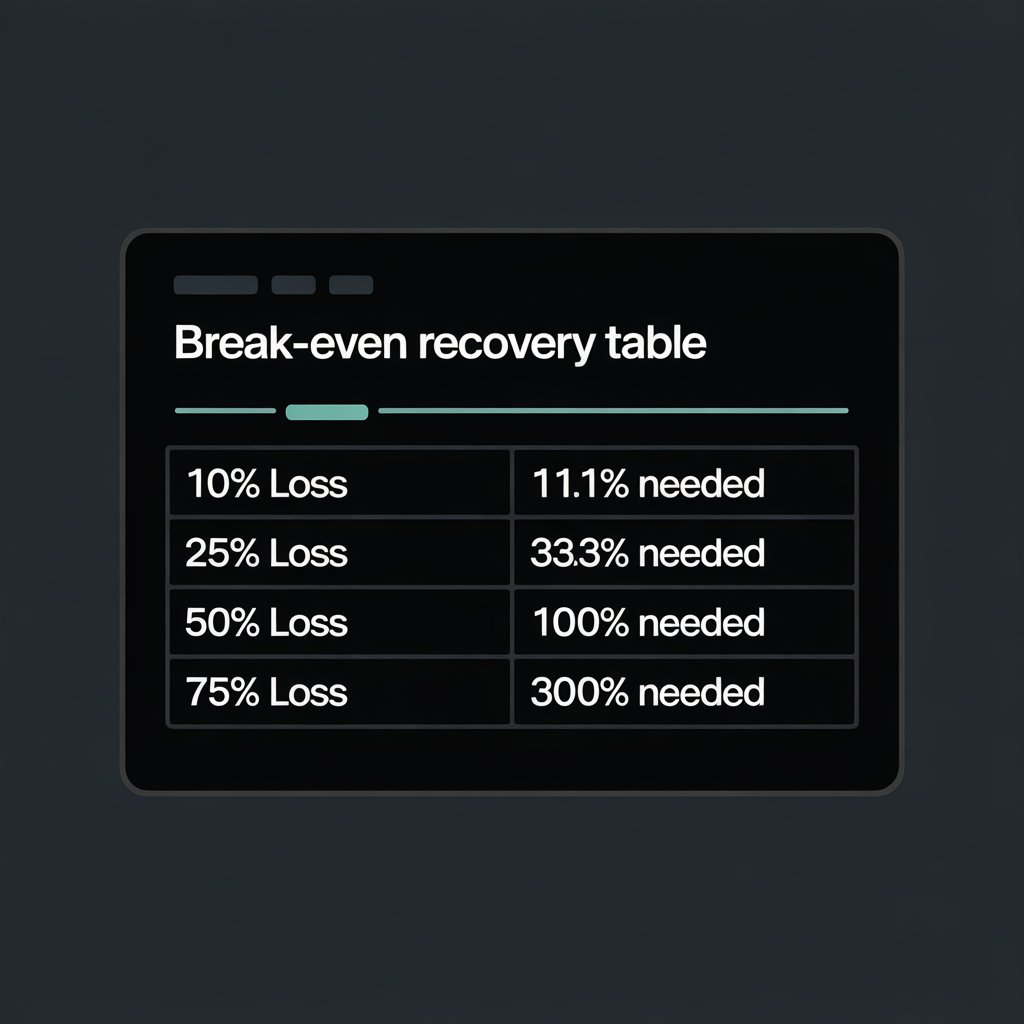
Here's the table that changes how you look at every position you'll ever take:
| Loss | Recovery Required |
|---|---|
| 10% | 11.1% |
| 25% | 33.3% |
| 50% | 100% |
| 75% | 300% |
A 50% loss requires a 100% gain to recover. Not a 50% gain. A hundred percent. You have to double your money just to get back to where you started.
This is not an argument for being timid. It's an argument for knowing your numbers before you enter any position because the mathematics of drawdown recovery are indifferent to your intentions.
The Six Instruments
The mathematics section of The Savvy Investor's Playbook covers six analytical instruments. Each one addresses a different gap in how most retail investors think about performance.
1. ROI - Return on Investment
The number your brokerage shows you is not your return. It's a percentage of the money you put in. What it doesn't account for: the time that money was deployed, the risk you absorbed to generate it, or how it compares to any alternative use of that capital.
ROI, calculated properly, is a starting point, not a conclusion.
2. CAGR - Compound Annual Growth Rate
CAGR answers the question ROI can't: how does this performance compare across different time periods?
A 30% gain in 8 months and a 30% gain in 18 months are not the same trade. CAGR normalizes for time, making year-over-year performance actually comparable.
Formula:
3. Sharpe Ratio - Return Per Unit of Risk
A 30% return through a 40% drawdown is a different trade than a 30% return through a 10% drawdown.
The Sharpe Ratio captures this. It measures return relative to the volatility you absorbed to get it. Two portfolios with identical returns can have radically different Sharpe Ratios — and the one with the higher ratio is the one that generated performance without unnecessary turbulence.
Formula:
4. ATR - Average True Range
Most stop-losses are placed wrong.
Not because investors don't understand the concept, but because they place stops based on how much they're willing to lose emotionally, not where the data says the asset actually moves.
ATR measures the average price range an asset covers in a given period. A stop placed inside the asset's normal daily range will be hit by routine volatility. A stop calibrated to ATR gives the trade room to breathe while still defining the exit point.
Formula:
Practical use: a stop at 1.5× ATR below your entry keeps you out of noise while still protecting against a real reversal.
5. Position Sizing - The Most Ignored Formula in Retail Investing
This is the calculation most investors never run. And its absence is responsible for more retail losses than bad stock picks.
The formula:
(Account Risk Amount) ÷ (Entry Price - Stop Price) = Shares to Buy
Breaking it down:
- Account Risk Amount: The maximum dollar amount you're willing to lose on this trade. Most systematic traders use 1-2% of total account value per position.
- Entry Price - Stop Price: The distance from your entry to your stop. This is the per-share loss if the trade goes against you.
- Shares to Buy: The result. Not a guess. Not a feeling. The number that keeps your risk within the parameters you defined.
- Account size: $25,000
- Maximum risk per trade: 2% = $500
- Entry price: $48.00
- Stop price: $44.50
- Distance: $3.50 per share
- Shares to buy: $500 ÷ $3.50 = 142 shares
You don't buy 200 because you like the setup. You buy 142 because that's the number that keeps your loss within the system.
6. The Break-Even Recovery Table
The full table, every common loss percentage mapped to the gain required to recover, is in the book. Print it. Keep it near your screen. The asymmetry gets worse faster than intuition suggests, and the visual reminder is more useful than the calculation alone.
Why This Matters More Than Stock Selection
The single most common assumption retail investors make is that the difference between success and failure is stock selection.
It isn't.
The difference is behavioral; whether you have a system that governs entry, exit, and position size; before you're emotionally involved in the outcome.
The investor who runs the position sizing formula, places their stop at 1.5× ATR, and records both in the Trading Plan Template before executing is not necessarily smarter than the investor who doesn't. They just have a structure that removes the variable that kills most retail accounts: the decision made under pressure, without a pre-committed plan.

The Trading Plan Template from Appendix A is free at devinmarshall.info/playbook. The full mathematics chapter, with worked examples across three different trade setups, is in The Savvy Investor's Playbook.
Comments
No comments yet. Be the first to share your thoughts.